SubPathClass

GlycoEnzDB
Comprehensive glycoEnzyme database and dynamic pathway generation

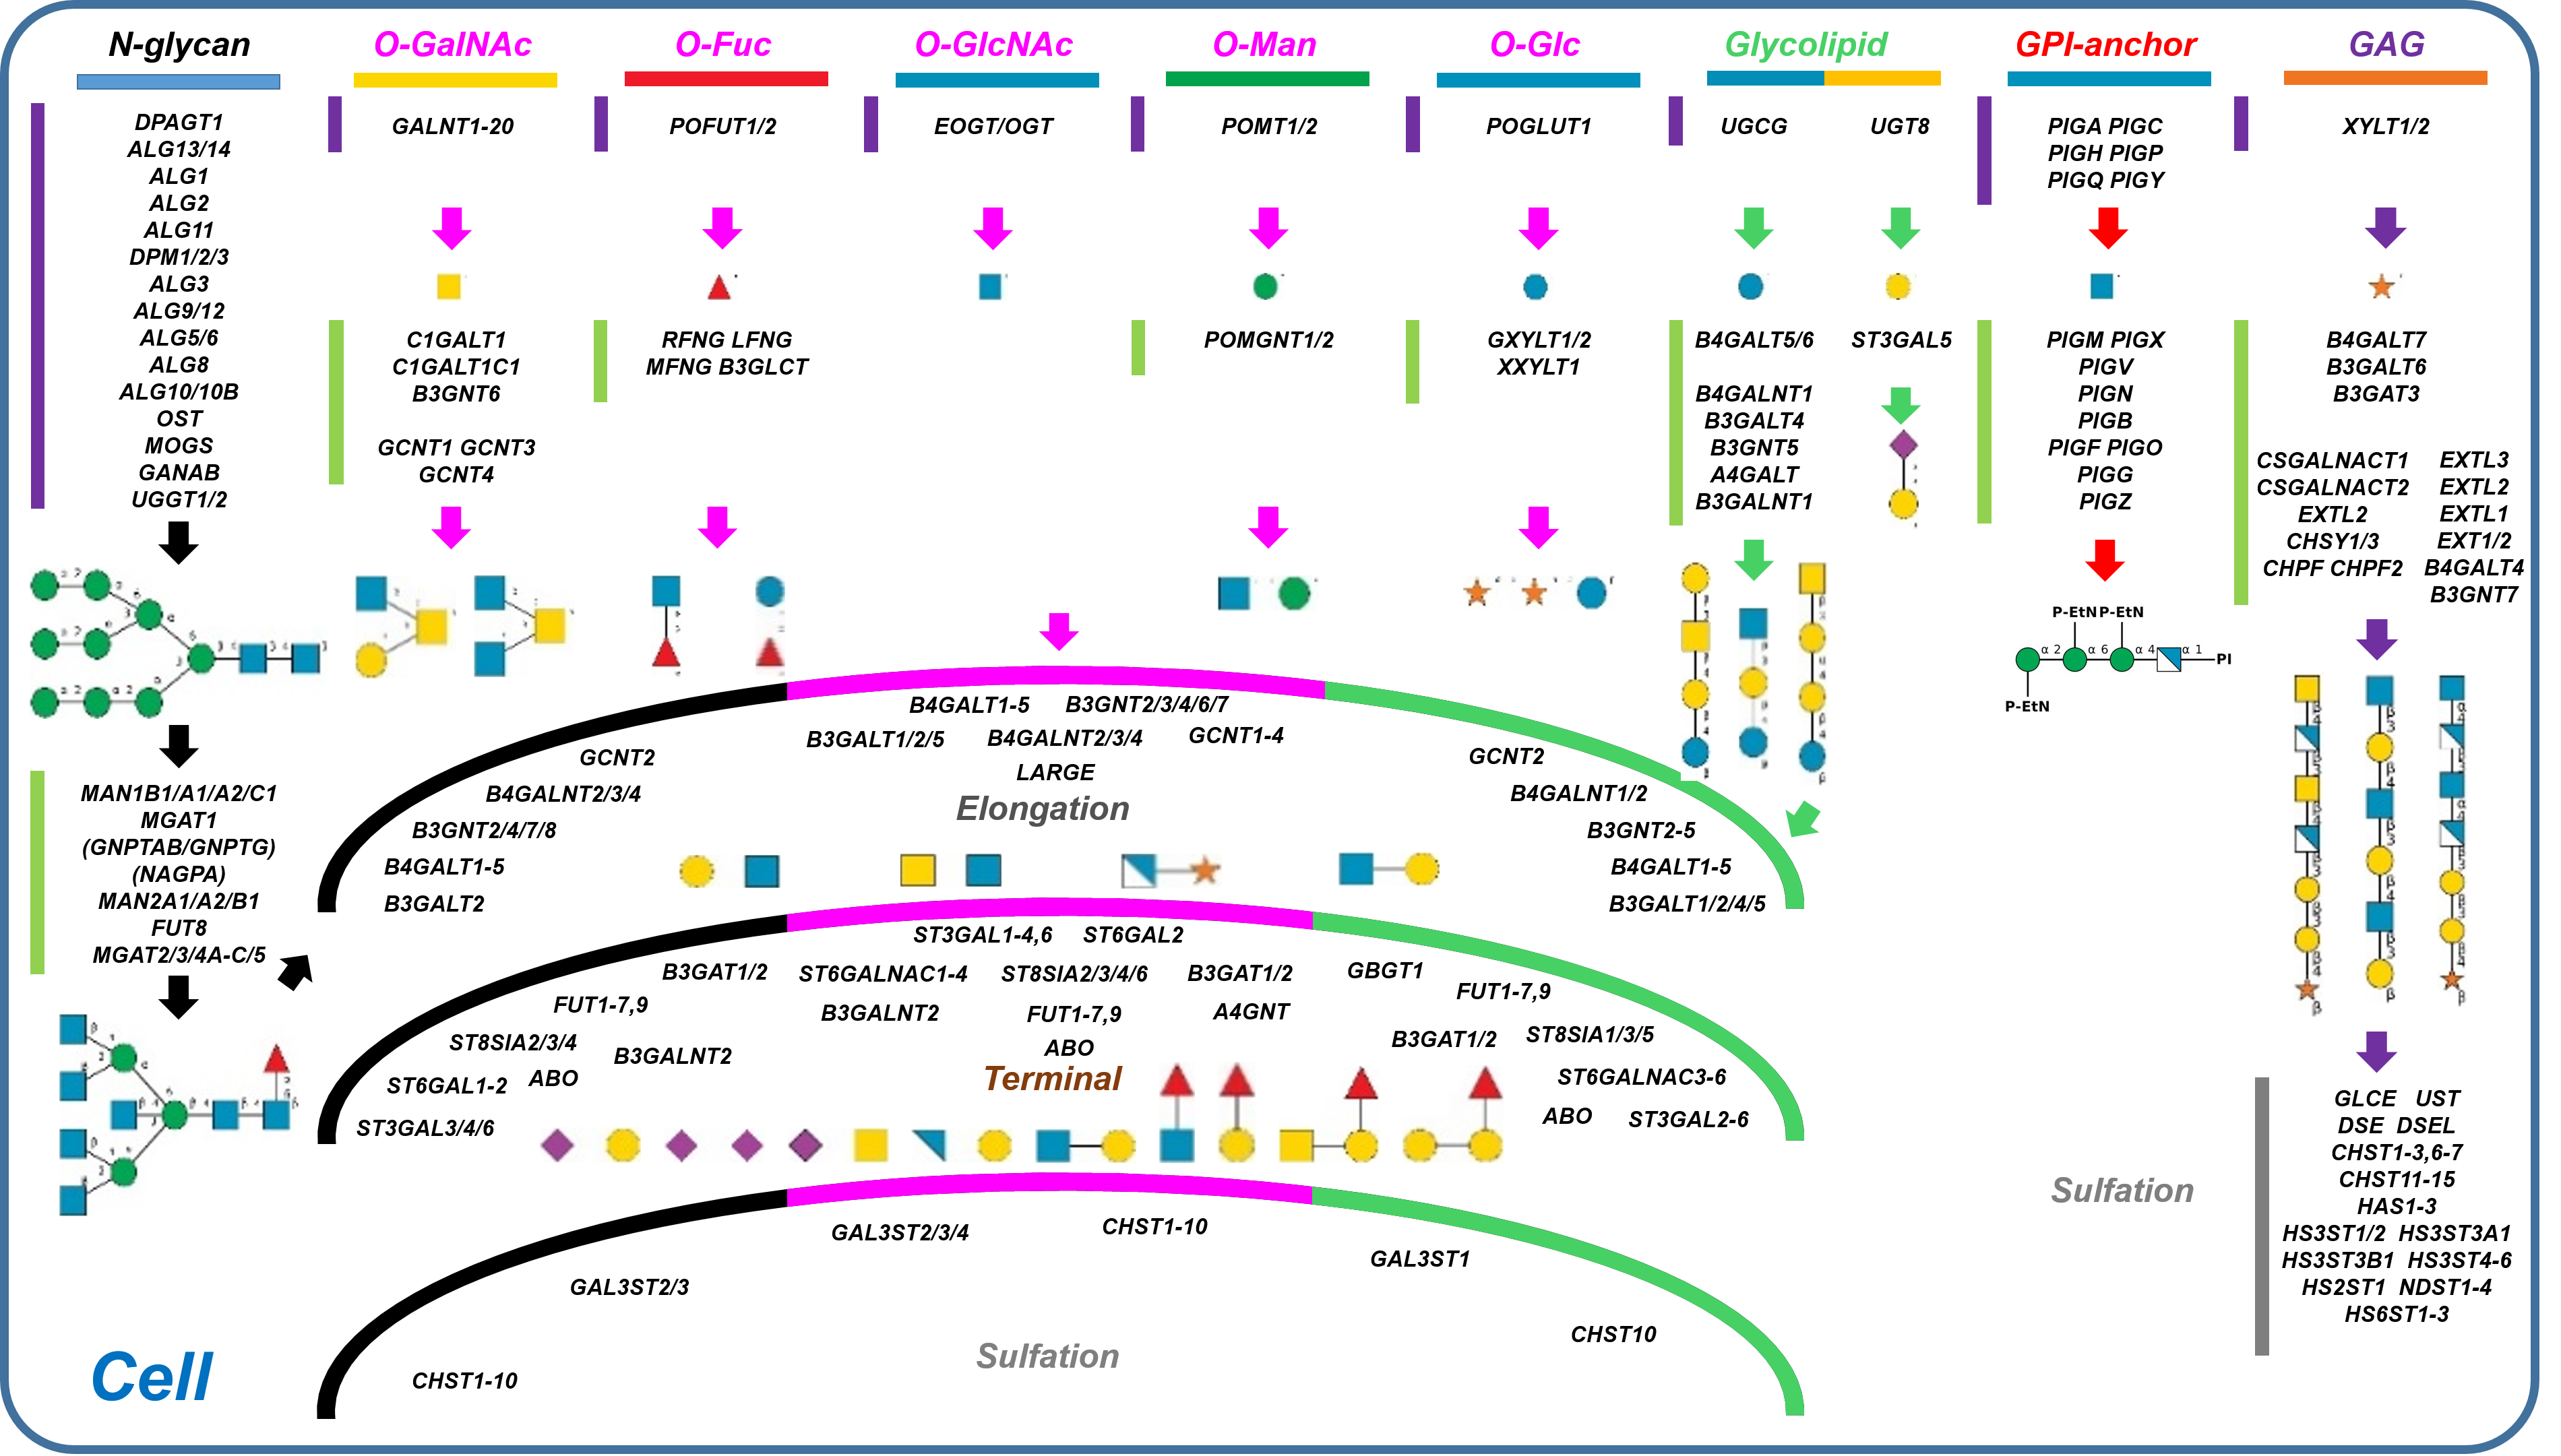
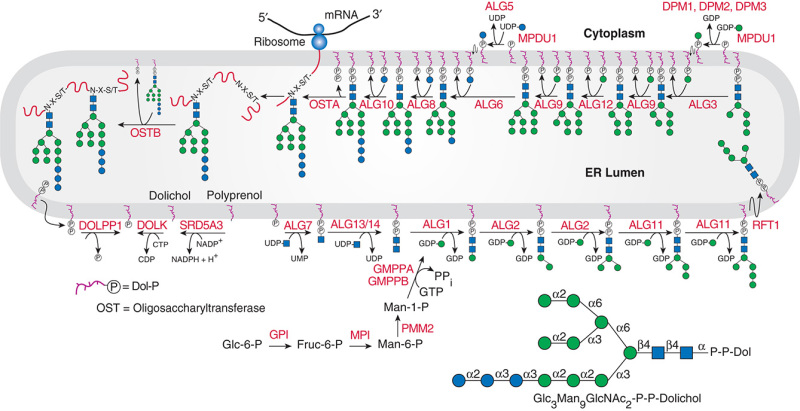
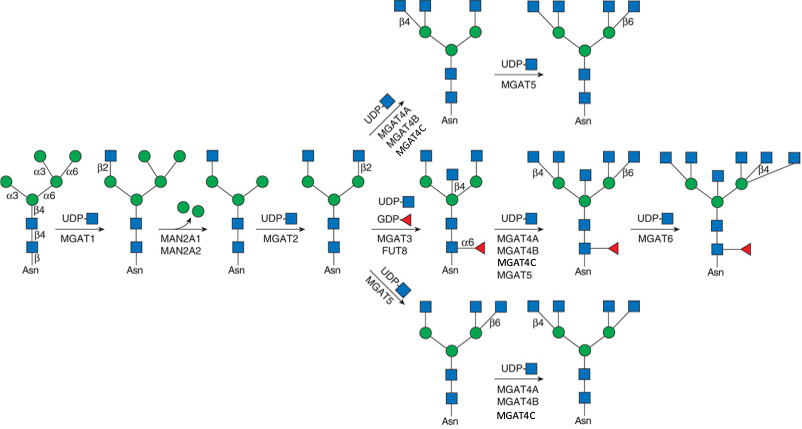
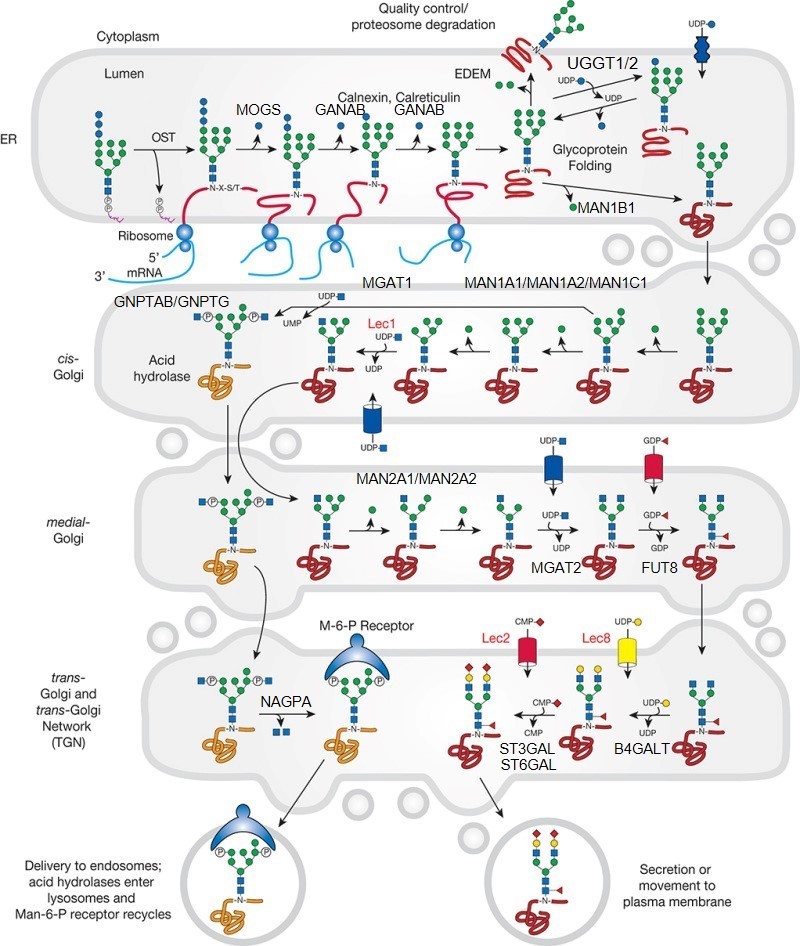
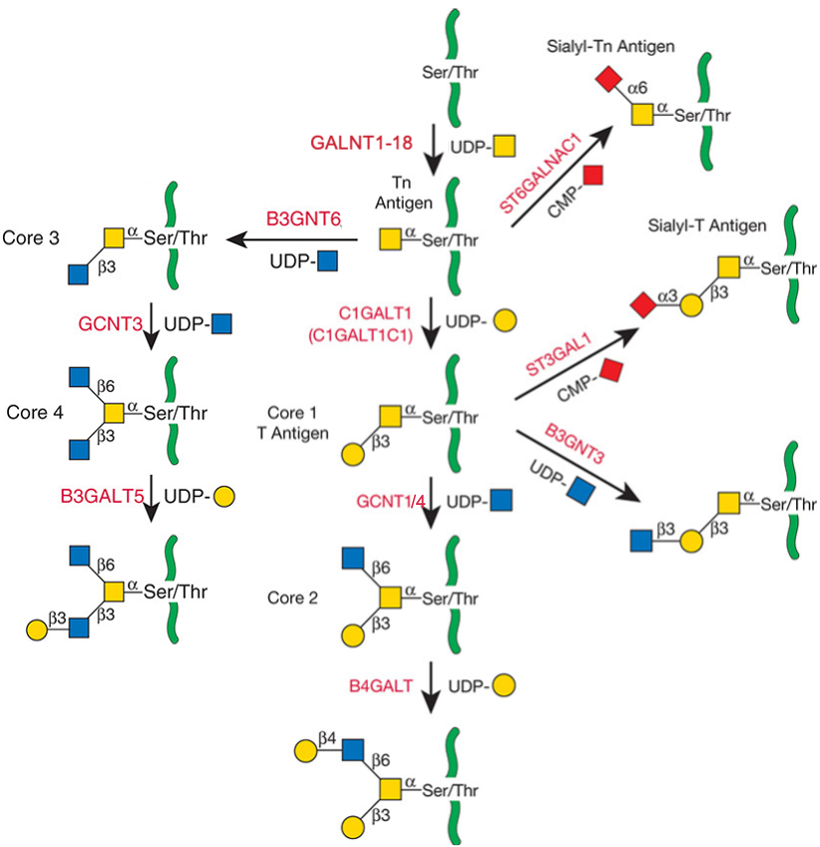
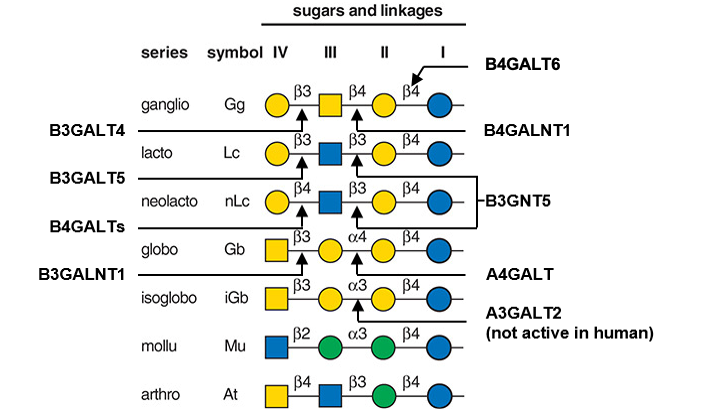
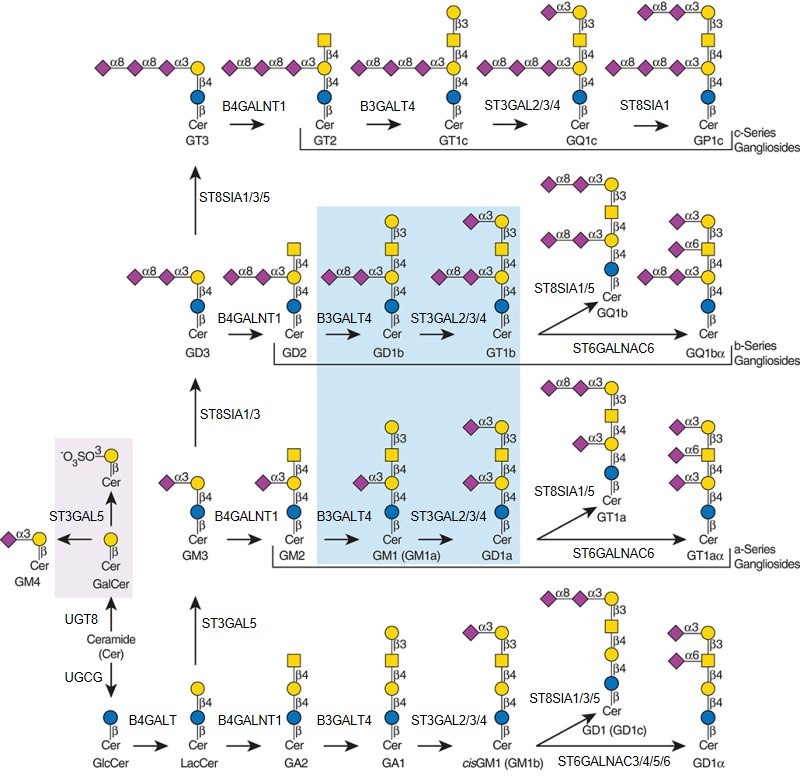
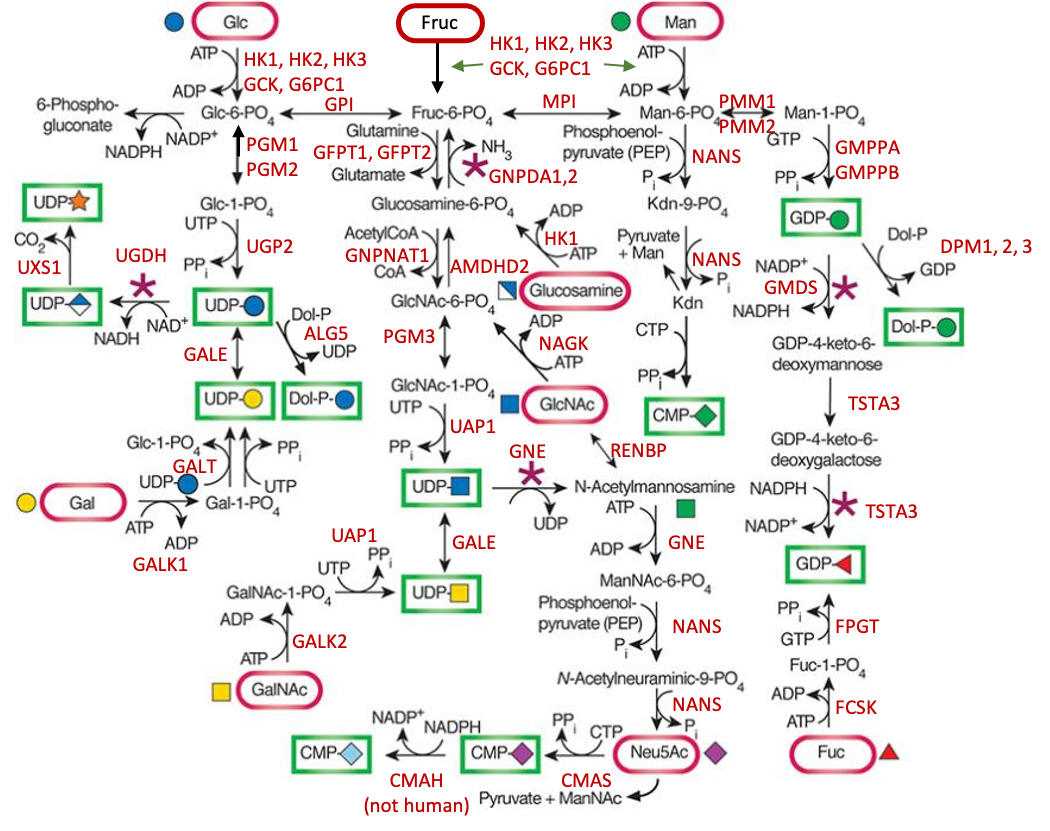
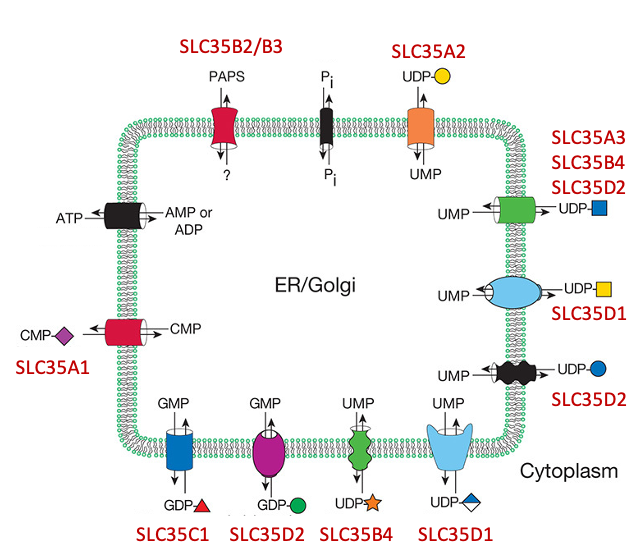
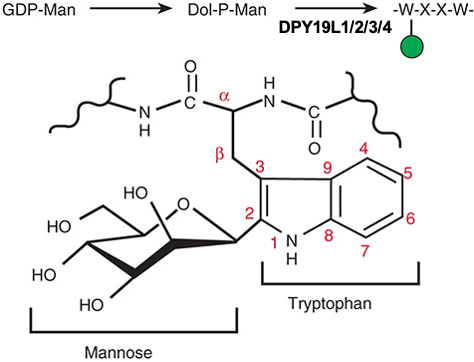
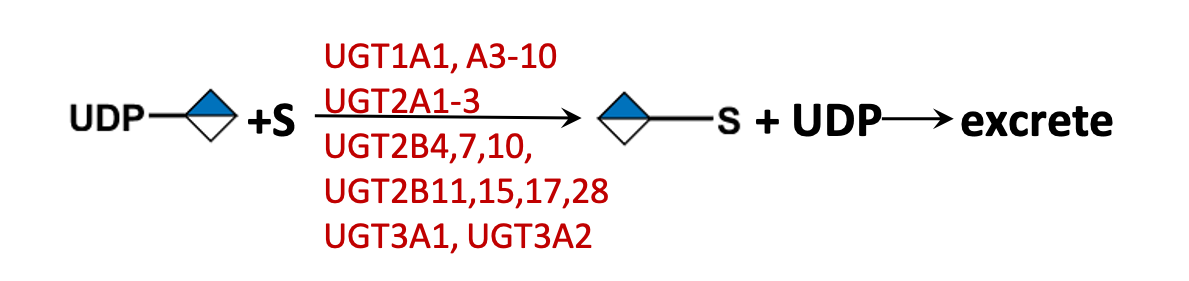
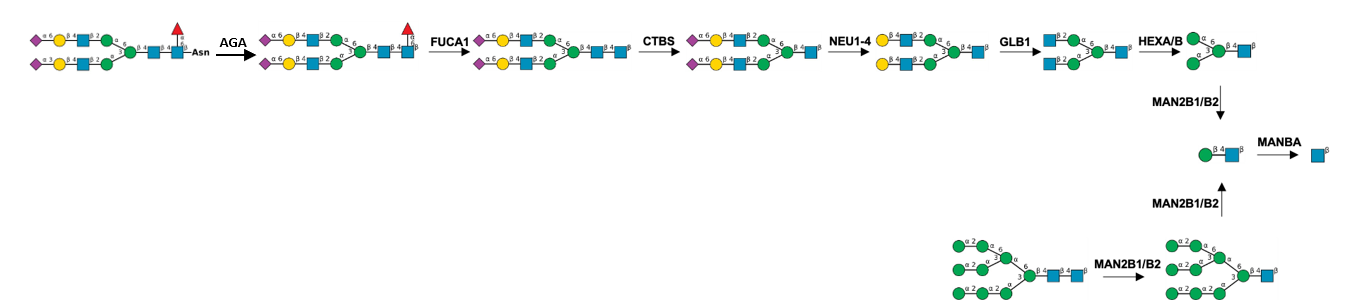
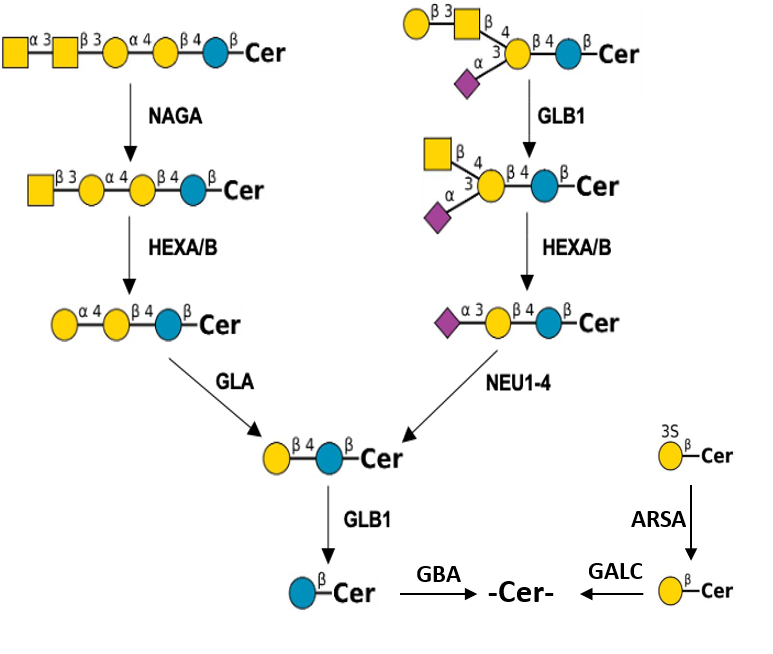
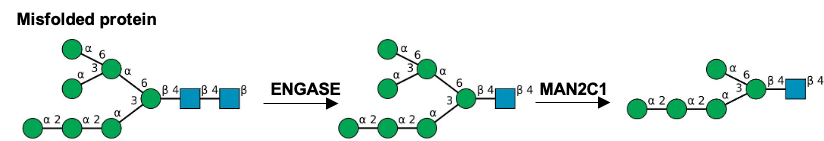
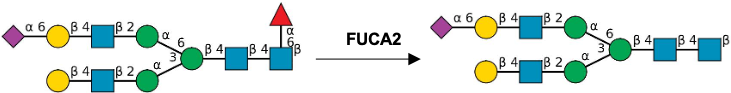
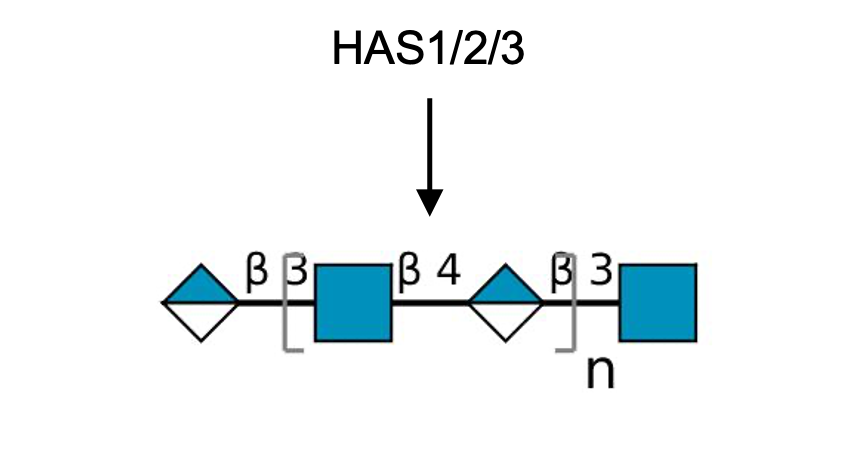
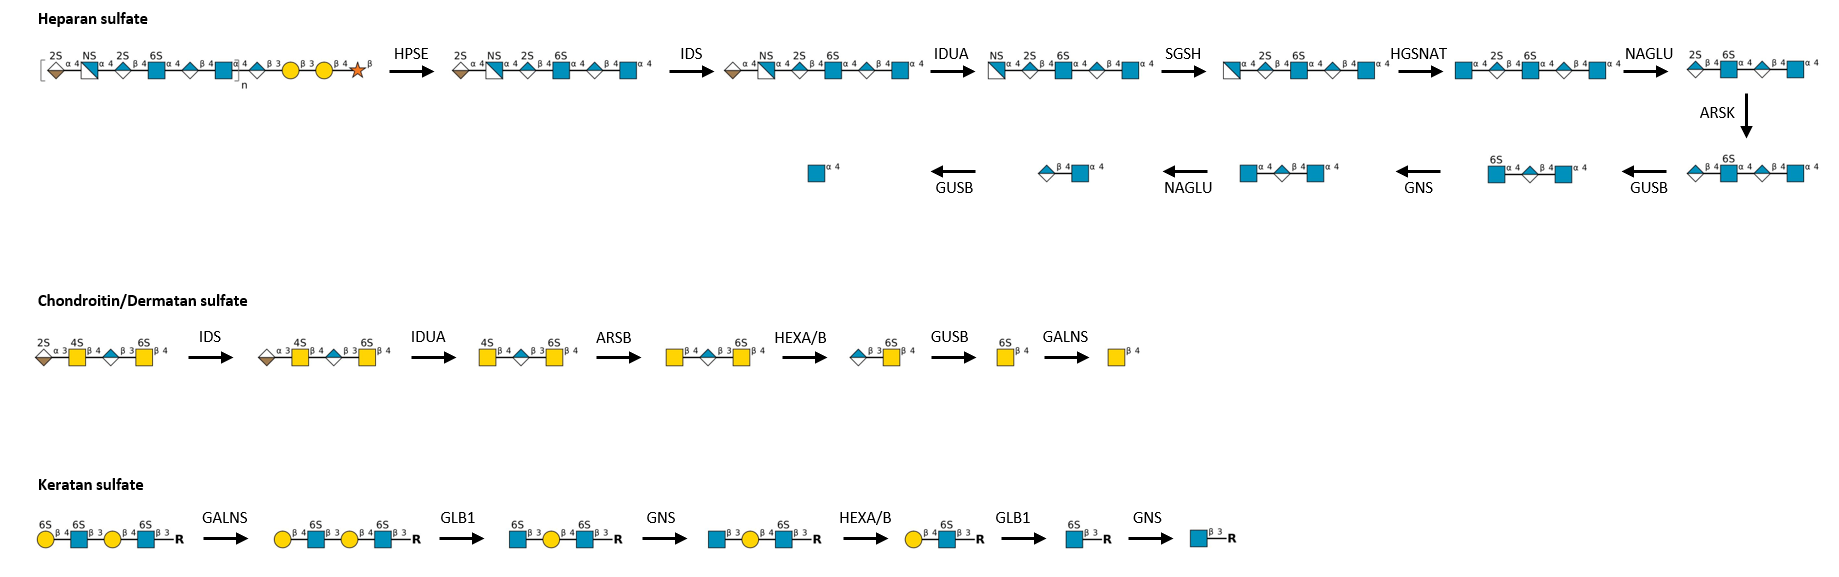
Description: The GlycoEnzDB is a manually curated glycoEnzyme database, primarily focused on humans. It covers 390 enzymes across 28 pathway maps. Facilities are also available to create custom glycosylation reaction pathways using experimental data in SBML format and for pathway simulation
Contacts: Sriram Neelamegham (neel@buffalo.edu), Yusen Zhou (yusenzho@buffalo.edu) or Ted Groth (tgroth@buffalo.edu).

GlycoEnzDB
Create glycosylation pathway
Custom database generation
Instructions/Reference
 

Pathway Map

SGSH


General Information
Gene Symbol:   
SGSH
Protein name:   
N-sulphoglucosamine sulphohydrolase
Enzyme Class:   
CAZy Family:   
E.C. No:   
Organs:   
Reaction (SNFG):   
Reaction (IUBMB):   
No specified reaction.

About

• N-sulfoglucosamine sulfohydrolase removes sulfate from GlcNAc in lysosomes. Involved in the breakdown and recycling of GAGs.
• Deficiency in SGSH activity results in mucopolysaccharidosis type IIIA. This causes an accumulation of heparan sulfates. The disease causes seizures, which results in rapid neurodegeneration and death in late childhood.


Related Pathway
KEGG ORTHOLOGY:   
KEGG Pathway:   
Reactome:   

Related Database
Organism:   
Homo sapiens
Uniprot:   
NCBI GeneID:   
GlyMap GeneID:   
DNA aRefSeq:   
Protein RefSeq:   
BRENDA:   
OMIM number:   
GeneCards database:   

Enzyme Specificity
Glycan Type:  
     GAG
Compartment:  
     
Substrate:  
     GlcNAc(b1-? S-6)
Product:  
     GlcNAc(b1-?)
Constraints:  
     None

Simulation Parameters
Mechaelis-Menten parameters (suggested)
VM:       (pmol/cell • hr)       KM:       (pM)
Relative conc of enzymes in compartment.(sum will be normalized to 1)
ER Cis- Medial- Trans- TGN


Expression Data in Tissue {ref. 5} Source from NCBI gene database
adrenal appendix bone marrow brain colon duodenum endometrium esophagus fat gall bladder heart kidney liver lung lymph node ovary pancreas placenta prostate salivary gland skin small intestine spleen stomach testis thyroid urinary bladder 12 10 8 6 4 2 0 RPKM
Expression Data in Cells {ref. 13} Source from Cancer Cell Line Encyclopedia database
Kidney Lung Breast Prostate Large intestine Ovary HL60 haematopoietic and lymphoid tissue Skin Central nervous system 786O A498 ACHN CAKI1 UO31 A549 EKVX HOP62 HOP92 NCIH226 NCIH23 NCIH322 NCIH460 NCIH522 SHP77 BT549 HS578T MCF7 MDAMB231 MDAMB468 T47D DU145 PC3 HCT116 HCT15 HT29 KM12 SW620 OVCAR4 OVCAR8 IGROV1 SKOV3 HL60 K562 RPMI8226 LOXIMVI MALME3M RPMI7951 SKMEL28 SKMEL5 UACC257 UACC62 SF268 SF295 SF539 SNB75 100 80 60 40 20 0 Transcripts per million (TPM)
Transcription factor {ref. 10}
No high degree of confidence data

miRNA-GlycoEnzyme Interactome {ref. 9}
miRNA Name Pos. Context Score Frac. Wt. Context Frac. Conserved Quality
hsa-miR-184 101-108 -0.534 98.0 -0.534 98.0 noncon
hsa-miR-661 27-34 -0.429 99.0 -0.429 99.0 noncon
hsa-miR-4804-5p 102-108 -0.392 93.0 -0.392 95.0 noncon
hsa-miR-6786-5p 477-484 -0.346 94.0 -0.346 96.0 noncon
hsa-miR-136-3p 1182-1188 -0.336 99.0 -0.049 73.0 noncon
hsa-miR-6735-3p 1111-1118 -0.307 97.0 -0.307 98.0 noncon
hsa-miR-4697-5p 315-322 -0.283 91.0 -0.283 92.0 noncon
hsa-miR-210-5p 215-222 -0.279 94.0 -0.279 95.0 noncon
hsa-miR-1237-5p 315-322 -0.278 91.0 -0.278 92.0 noncon
hsa-miR-432-3p 114-121 -0.277 94.0 -0.277 95.0 noncon
hsa-miR-3675-5p 581-587 -0.276 93.0 -0.276 95.0 noncon
hsa-miR-4488 315-322 -0.275 90.0 -0.275 92.0 noncon
hsa-miR-4727-5p 672-678 -0.256 94.0 -0.256 96.0 noncon
hsa-miR-6801-3p 234-241 -0.253 91.0 -0.253 93.0 noncon